Quick Answer
A charger efficiency curve can look impressive in a supplier quotation, especially when one large peak percentage is highlighted. The problem is that this single number may not represent normal customer use. We help buyers turn the curve into a practical comparison tool by asking for load-range data and complete test conditions.
A charger efficiency curve is useful when it shows how efficiently a charger converts input power into output power across the loads customers are likely to use. Buyers should compare curves only when input voltage, output profile, ambient temperature, test setup, and measurement method are disclosed. A high peak alone does not prove better everyday performance, safety, compliance, reliability, or production consistency.
For retail, wholesale, and import teams, the key question is not simply “Which charger has the highest peak efficiency?” The better question is: Which supplier provides evidence that this charger performs consistently across our expected charging scenarios under comparable conditions? That shift can reduce the risk of selecting an attractive-looking SKU based on incomplete marketing data.
Why Is a Charger Efficiency Curve Not a “Higher Peak Wins” Score?
A high point on a charger efficiency curve can create false confidence during product selection. Buyers may see “92% efficiency” and assume the charger is automatically superior. The issue is that this figure may appear only at one narrow load point, while customers use the charger at many different output levels.
A charger efficiency curve is not a higher-peak-wins score because the most relevant efficiency is the efficiency at expected operating loads, not only the single best result. Buyers should compare multi-load data under equivalent test conditions and use the curve as one part of a broader supplier qualification process.
Start With What the Curve Actually Shows
A charger efficiency curve normally plots conversion efficiency against output load. In simple terms, it shows how much of the power taken from the wall is delivered as usable output power and how much is lost during conversion.
The basic relationship is:
Efficiency = Output Power ÷ Input Power × 100%
For example, if a charger provides 18 W at the output and draws 20 W at the input, the calculated conversion efficiency is 90%. The remaining power is generally lost as heat within the conversion process.[2] This example is only a simple calculation, not a benchmark for any specific charger model.
For procurement purposes, the important point is that efficiency changes with load[1]. A charger may behave differently when supplying:
- A low-power wearable device
- A TWS earbud charging case
- A smartphone at moderate charge
- A phone using a higher-voltage USB Power Delivery profile
- A tablet drawing near the charger’s rated output
- A multi-port charger with one or more active ports
A supplier may show a curve that reaches its maximum at 70% or 80% of rated load. That is not necessarily a problem. However, it becomes less useful if your customers mostly use the product at 10% to 30% of rated load, or if the charger is sold primarily for devices that do not regularly draw near maximum power.
In our supplier-selection discussions, we encourage buyers to connect the curve to the SKU’s actual retail position. A compact 20 W USB-C charger and a 100 W GaN desktop charger may both show strong peak figures, but they serve different usage patterns. Their curves should be reviewed in the context of their intended devices, ports, protocols, and user expectations.
Peak Efficiency Can Hide Weaknesses at Relevant Loads
The peak point on a charger efficiency curve is only one measurement. It can be useful, but it does not describe the whole operating range.
Consider two fictional 65 W chargers. Supplier A shows a peak efficiency of 93% at 52 W. Supplier B shows a peak efficiency of 91.5% at 45 W. On a quotation, Supplier A may appear to win immediately.
However, the comparison changes if most intended users charge a smartphone, a small tablet, or a laptop that commonly draws between 20 W and 40 W. If Supplier B performs more efficiently in that range, its curve may be more relevant for the product’s practical positioning.
The table below uses illustrative figures only. It is not a recommendation, a test result, or a universal performance target.
| Output Load | Supplier A Example | Supplier B Example | Procurement Interpretation |
|---|---|---|---|
| 10 W | 78% | 82% | Relevant for lower-power charging scenarios |
| 20 W | 85% | 88% | Useful for many phone and tablet use cases |
| 35 W | 90% | 91% | Relevant for mid-range USB-C charging |
| 45 W | 92% | 91.5% | Both may be competitive depending on device mix |
| 52 W | 93% | 91% | Supplier A reaches a higher peak |
| 65 W | 89% | 89% | Full-load behavior still needs review |
This example shows why a single headline percentage can be misleading. Supplier A has the higher peak, but Supplier B has stronger efficiency at lower and medium output levels. Neither charger can be called “better” without considering the intended market and verifying the underlying test conditions.
A retailer selling entry-level USB-C chargers may care most about phone-oriented loads. A distributor supplying laptop accessories may focus on 45 W, 65 W, or 100 W operating points. A wholesale buyer of multi-port charging stations may need to understand efficiency under different port combinations, not just one total-load condition.
Match the Charger Efficiency Curve to Your Target Device Mix
A charger efficiency curve becomes more valuable when buyers define the expected load range before comparing suppliers. This step sounds basic, but it is often skipped when teams are working quickly through quotations, catalogues, and samples.
We suggest that buyers first map the charger SKU to likely charging scenarios.
For lower-power chargers
For products such as 5 W, 10 W, 12 W, 18 W, or 20 W chargers, buyers may want data around lower and medium loads. A charger sold with TWS accessories, smart watches, basic smartphones, or other low-power devices may spend significant time below its maximum rating.
Useful supplier follow-up points include:
- Efficiency at 10%, 25%, 50%, 75%, and 100% load
- The output voltage and current used for each test point
- Whether the charger was tested on a fixed USB-A output or USB-C output
- The input voltage and frequency used during the test
- Ambient temperature during the measurement
- Whether the tested unit was a production sample, engineering sample, or another sample type
For USB-C PD and GaN chargers
For USB-C PD chargers, the picture can become more complex. A 65 W charger may support multiple profiles, such as 5 V, 9 V, 12 V, 15 V, or 20 V, depending on its design and declared protocol support. Efficiency may differ between these output conditions.[3]
Buyers should not assume that a curve measured at one output voltage applies to every PD profile. A supplier should clarify which output voltage and current combination was used at each load point.
For example, a 65 W charger could be tested at 20 V and varying current levels. That curve may be relevant for laptop-oriented use. It may not fully describe performance when charging a phone at 9 V or when a lower-power device is connected.
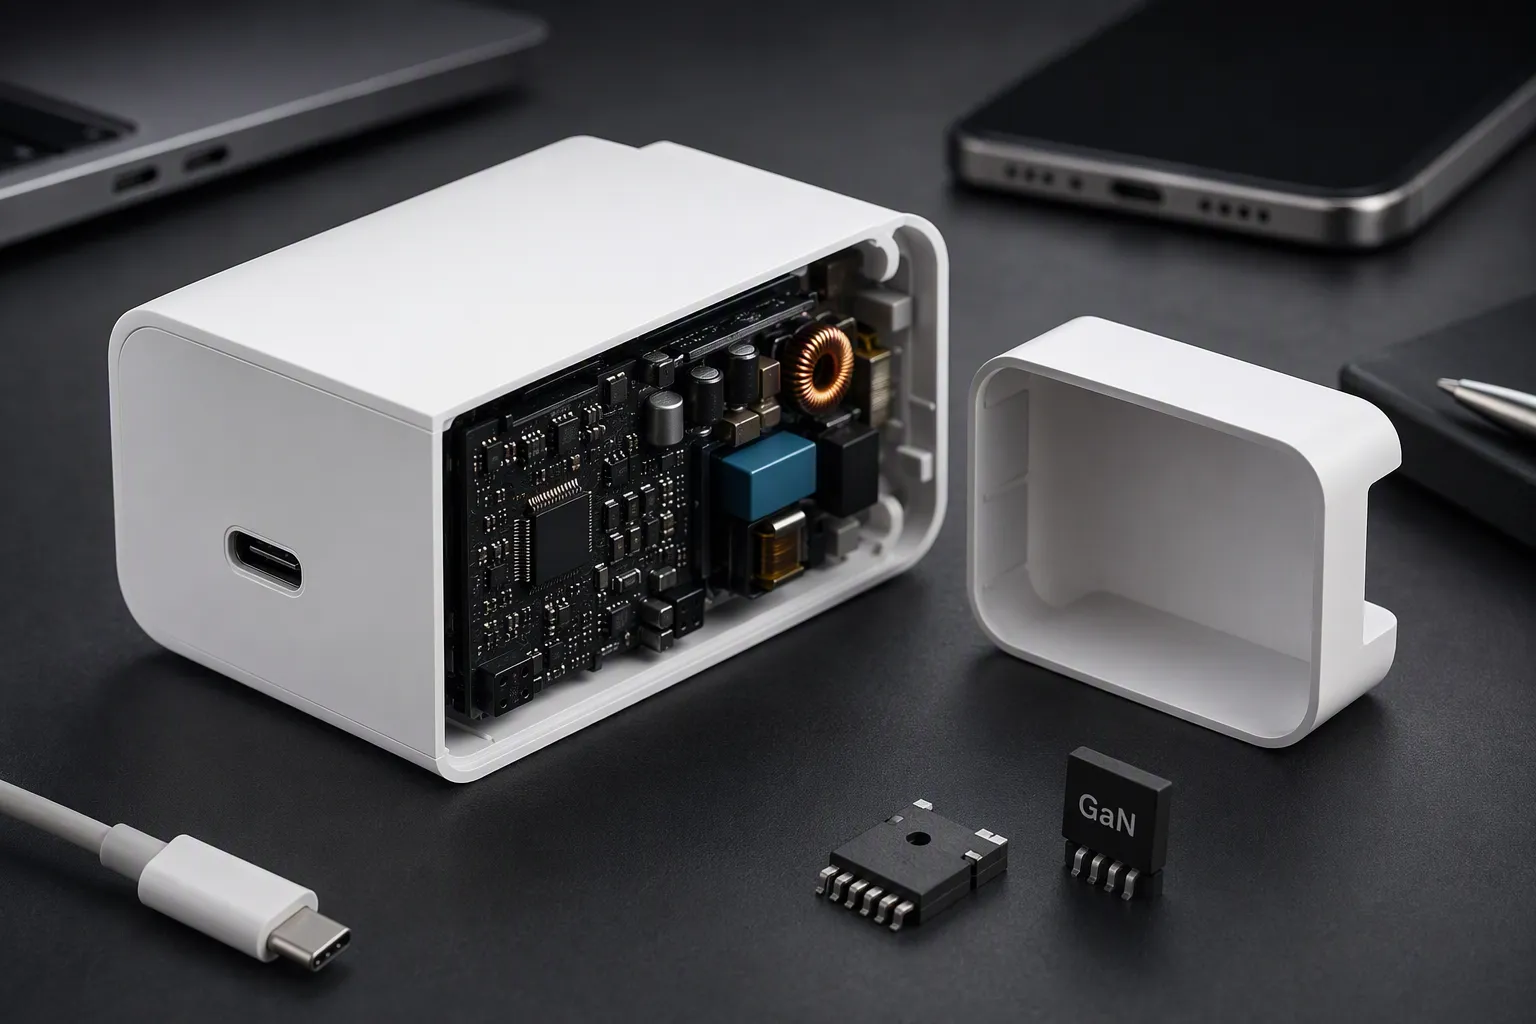
For GaN chargers, the term “GaN” describes a design approach and component technology[4]. It does not automatically make one unit more efficient than another at every load point.[5] Buyers should still ask for the same procurement evidence: multi-load results, conditions, production controls, and supporting documentation.
For multi-port chargers
Multi-port models deserve extra attention. A single-port charger efficiency curve may not represent performance when two or three ports are active. Output allocation, protocol negotiation, internal thermal conditions, and total load can all change.[6]
For a two-port or three-port charger, buyers should request clarity on scenarios such as:
- One USB-C port operating alone.
- Two ports operating at a shared total load.
- USB-C plus USB-A operation.
- Common output allocation combinations.
- Near-maximum total output operation.
- Lower-load mixed-device scenarios.
A supplier may not have a full curve for every possible combination. That is understandable. Still, the supplier should be able to explain which operating cases have been measured and which data are available for buyer review.
Compare Test Conditions Before Comparing Percentages

The biggest procurement mistake is comparing two charger efficiency curve documents as if they are identical tests. They may not be.
One supplier may test at 230 V input, while another tests at 115 V. One may use a 20 V output profile, while another uses 9 V. One may report results at room temperature, while another may not state ambient conditions at all. A difference of one or two percentage points may have limited meaning if the measurement conditions are not aligned.
Before ranking suppliers, buyers should request a complete test-condition record.
| Test Condition | Why Buyers Should Ask | Suggested Supplier Request |
|---|---|---|
| Input voltage and frequency | Efficiency can vary by AC input condition[7] | “Please state AC input voltage and frequency for each result.” |
| Output voltage and current | A USB-C charger may perform differently by PD profile | “Please identify the output profile used at every load point.” |
| Output load points | One peak point does not show the operating range | “Please provide data at multiple loads, such as 10%, 25%, 50%, 75%, and 100%.” |
| Ambient temperature | Temperature can affect measured behavior[8] | “Please state the ambient temperature and stabilization conditions.” |
| Test equipment | Instrument quality and setup affect confidence | “Please identify the power analyzer, load equipment, and measurement method.” |
| Sample status | Prototype and mass-production units may differ | “Please clarify whether the sample represents planned production.” |
| Port configuration | Single-port and multi-port results are not interchangeable | “Please confirm active ports and output allocation during testing.” |
We do not treat supplier-provided test charts as independently verified facts. Instead, we treat them as supplier evidence that needs context. A complete record makes that evidence easier for a purchasing team, quality team, or qualified technical reviewer to assess.
Ask for Multi-Load Data, Not a Headline Claim
In many quotations, buyers see statements such as “high efficiency,” “up to 93% efficiency,” or “energy-saving design.” These phrases may be useful as early product information, but they are not enough for a responsible technical comparison.
A better request is simple:
“Please provide the charger efficiency curve or multi-load efficiency data for this model, including input condition, output voltage/current, ambient temperature, sample status, active ports, and measurement method.”
This question does not require buyers to become power-electronics specialists. It simply asks the supplier to show how the claim was generated.
We find that this approach also helps reveal differences in supplier readiness. A supplier that can provide organized specifications, test conditions, port-allocation information, and relevant documents may be easier to work with during later stages of product development and order management. That does not guarantee product quality, but it can support a more disciplined evaluation process.
When comparing several chargers, buyers can use a simple scorecard rather than focusing on the highest peak figure.
| Evaluation Area | What to Review | Why It Matters |
|---|---|---|
| Load-range relevance | Efficiency at expected device loads | Connects data with actual customer use |
| Test transparency | Full conditions and method disclosed | Makes supplier comparisons more meaningful |
| Output profile coverage | Relevant PD or fixed-voltage profiles included | Avoids drawing conclusions from one profile |
| Multi-port information | Port combinations and allocation explained | Important for multi-output SKUs |
| Document control | Model number, revision, date, and sample status | Reduces confusion between versions |
| Supplier responsiveness | Clarity and speed of technical follow-up | Supports smoother procurement communication |
Do Not Confuse Efficiency With Charging Speed

A common misunderstanding is that a more efficient charger must charge a phone faster. That is not necessarily true.
Conversion efficiency describes how effectively the charger converts AC input power into DC output power. Charging speed depends on other factors, including the device’s charging limits, cable capability, charging protocol negotiation, battery state, thermal controls, and the power profile supported by both charger and device.
For example, a 20 W charger may have a strong charger efficiency curve, but it cannot deliver 45 W if its rated output and protocol design do not support it. Likewise, a 65 W charger may support higher output power, but a smartphone may only accept a lower level based on its own charging system.
Buyers should review these items separately:
- Rated output power
- USB PD, PPS, QC, or other declared protocol support
- Output profile list
- Cable requirements for higher-power applications
- Single-port and multi-port allocation
- Efficiency data across relevant loads
- Device compatibility expectations
- Packaging claims and consumer-facing wording
This separation is important for product listings and retail communication. A product team should avoid using efficiency claims to imply faster charging unless the claim is supported by appropriate, verified product information.
Efficiency Is Not a Substitute for Safety, Compliance, or Reliability Review
A charger efficiency curve can support a procurement decision, but it is only one piece of evidence. It does not prove that a charger meets safety requirements, holds valid certification, has acceptable thermal performance, or will remain consistent over repeated production batches.
For European and North American markets, buyers should conduct a broader document and supplier review appropriate to their sales channels and product category. Requirements vary by market, product design, importer role, and customer expectations. Qualified compliance professionals should review application-specific obligations.
A broader evaluation may include:
- Certification documents that match the exact model and factory
- Test reports and their scope, dates, and applicable standards
- Product labels, plug versions, and packaging information
- Bill of materials and controlled component information where appropriate
- Factory quality-control procedures
- Incoming, in-process, and final inspection records
- AQL or inspection requirements agreed for the order
- Sample approval process
- Warranty and after-sales handling
- Change-control procedures for components, PCB revisions, and tooling
- Thermal and reliability evidence where relevant to the application
Buyers should verify documents directly with the relevant issuer, testing organization, or qualified professional when necessary. A supplier statement alone may not be enough, particularly for a new supplier relationship or a higher-risk product category.
In our role as a Shenzhen 3C export trading company, we often help translate supplier specification materials into clearer questions for overseas buyers. We do not present a curve as proof of all other product attributes. Instead, we encourage a layered review: performance data, documentation, sample assessment, quality controls, commercial terms, and post-sale support.
Build the Curve Into Your Supplier Qualification Workflow
The best time to request a charger efficiency curve is before final SKU selection, not after packaging has been approved or an order is close to placement.
A practical workflow can look like this:
-
Define the product use case.
Identify the target devices, rated output, port count, target market, expected retail position, and likely user loads. -
Shortlist suppliers based on basic capability.
Review product range, MOQ, lead time, customization options, communication quality, and available documentation. -
Request comparable efficiency evidence.
Ask each shortlisted supplier for multi-load data under stated conditions. -
Normalize the comparison.
Compare only data tested under equivalent or clearly explained conditions. Flag missing conditions rather than guessing. -
Review samples and documents.
Ensure the sample model, revision, output specification, and documentation correspond to the commercial offer. -
Set inspection and change-control expectations.
Confirm what will be checked during production and what happens if components or designs change. -
Make a balanced purchasing decision.
Consider price, quality records, delivery reliability, technical transparency, customization support, and after-sales arrangements alongside efficiency.
This workflow does not eliminate risk. However, it can reduce the chance that a buyer chooses a charger mainly because of one impressive number in a catalogue.
For a private-label charger program, the same logic applies. Branding, housing color, packaging, plug type, cable inclusion, and language versions all matter commercially. Yet the underlying electrical specification should remain clearly controlled. If a supplier changes a board revision, controller, transformer, or key component, buyers should understand whether that change affects the declared performance data or documentation.
Frequently Asked Questions
What is a charger efficiency curve?
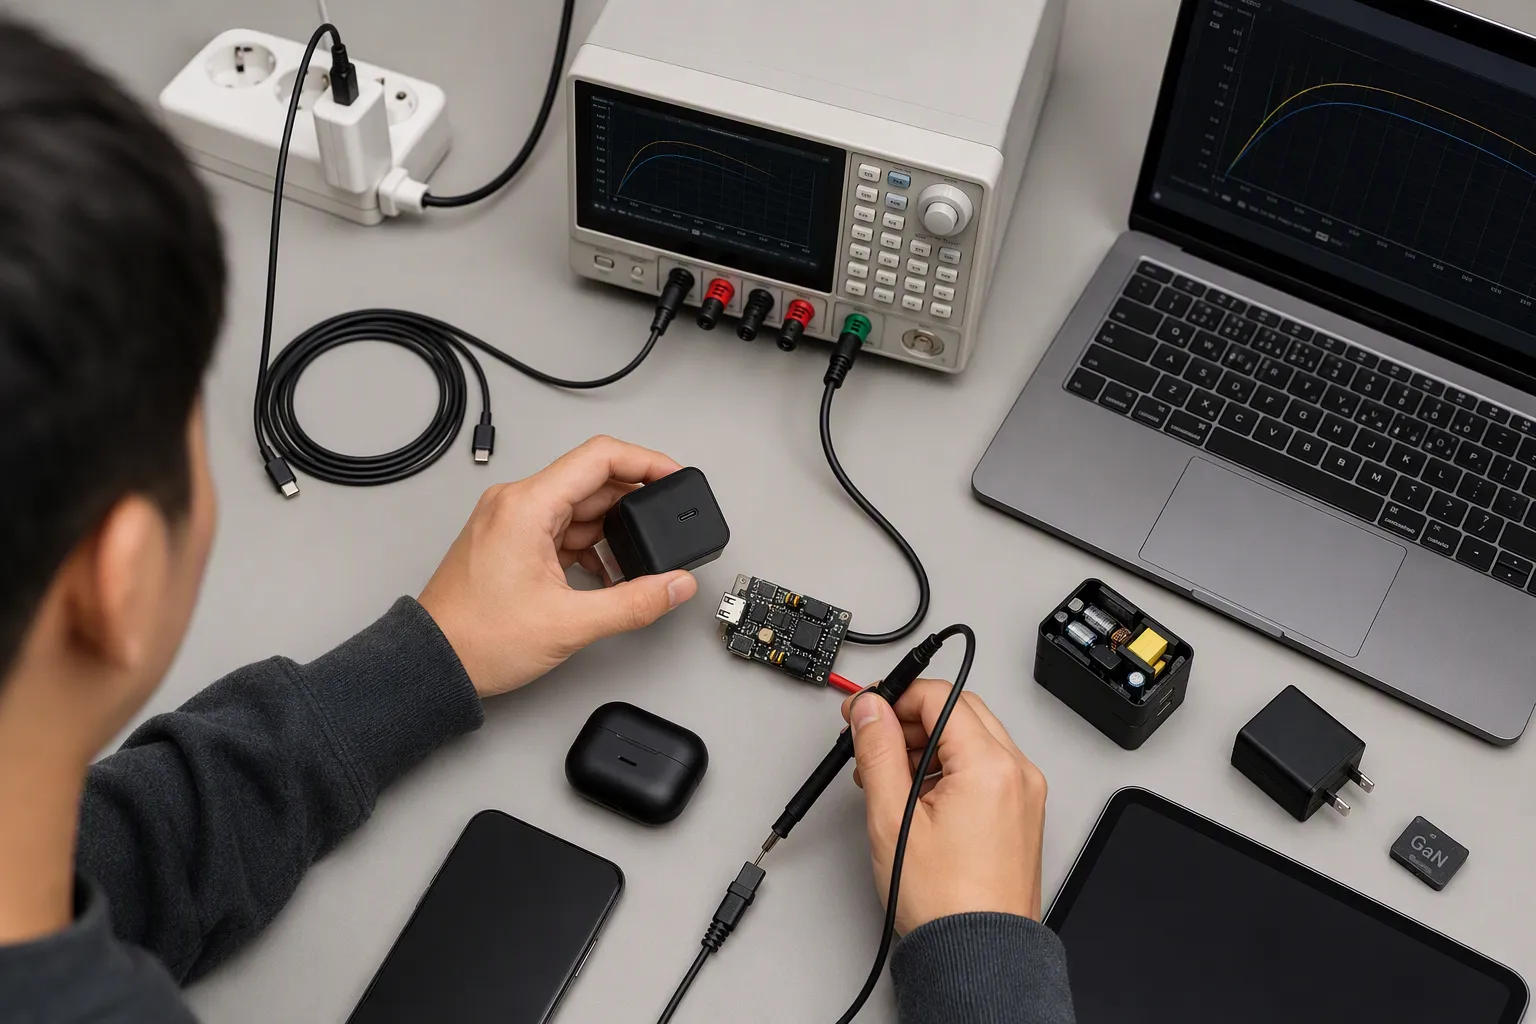
A charger efficiency curve is a chart that shows how efficiently a charger converts input power into output power at different output loads. It helps buyers see whether performance changes at low, medium, and high loads instead of relying only on one advertised peak percentage.
Is a higher charger efficiency percentage always better?
No. A higher peak percentage may be relevant, but it does not automatically mean the charger performs better in normal use. Buyers should compare efficiency at the loads their target devices are likely to draw and confirm that test conditions are equivalent.
What test conditions should a charger supplier disclose?
Buyers should request input voltage and frequency, output voltage and current, load points, ambient temperature, active ports, sample status, measurement method, and test equipment details. These conditions help purchasing teams assess whether different supplier curves can be compared responsibly.
Does a charger efficiency curve prove safety certification or compliance?
No. A charger efficiency curve does not prove safety compliance, certification validity, EMC performance, thermal behavior, reliability, or production consistency. Buyers should verify relevant documents, model scope, and market-specific requirements through appropriate channels and qualified professionals.
Does charger efficiency affect charging speed?
Efficiency and charging speed are different. Efficiency describes power conversion losses inside the charger. Charging speed depends on rated output power, protocols, cable capability, device limits, battery condition, and thermal controls. Buyers should assess each factor separately.
Conclusion
A charger efficiency curve is most useful when buyers treat it as procurement evidence, not as a marketing trophy. The highest peak figure may matter, but efficiency across the expected load range matters more. We recommend requesting multi-load data with complete test conditions, then reviewing it alongside output profiles, documentation, sample status, quality controls, MOQ, lead time, and after-sales support. If you are sourcing USB chargers, GaN chargers, or multi-port charging products for Europe or North America, we can help you turn supplier specifications into practical comparison questions.
Sources
- [PDF] Improving Efficiency at Higher Loads with High Switching Frequencies", Power-converter efficiency generally varies with output load because fixed losses and load-dependent conduction and switching losses contribute in different proportions across the operating range
- [PDF] Behavior, Switching Losses, and Efficiency Enhancement Potentials ...", In electrical power conversion, the portion of input power not delivered to the load is predominantly dissipated as heat through component losses such as conduction, switching, and magnetic losses
- USB-C power delivery for military portable systems", Measured switched-mode power-supply efficiency can differ by output-voltage and current operating point because converter currents, switching conditions, and component losses change with the selected profile
- Eight Inch GaN-on-Si Super Junction Devices for Next ... - ARPA-E", Gallium nitride (GaN) is a wide-bandgap semiconductor material used for power-electronic devices, including high-frequency power-conversion applications
- 20-kV GaN Switch Technology Demonstrated in High-Efficiency ...", Although GaN devices can enable high-efficiency power conversion, finished-converter efficiency remains dependent on circuit topology, component selection, control strategy, and operating conditions
- A 20-Year Retrospective on Power and Thermal Modeling ...", USB Power Delivery uses negotiated source and sink power capabilities, and the electrical behavior of multi-output power supplies depends on the active outputs and their combined loading
- [PDF] Using the TPS54061 to Create an Inverting Power Supply", The measured efficiency of an AC-DC power supply can vary with input voltage and frequency because rectification, switching, and other loss contributions change with operating conditions
- New high-power thermoelectric device may provide cooling in next ...", Ambient and component temperatures affect semiconductor and passive-component loss characteristics and may therefore affect measured power-converter efficiency and operating behavior